Science investigation
03 Feb 2013
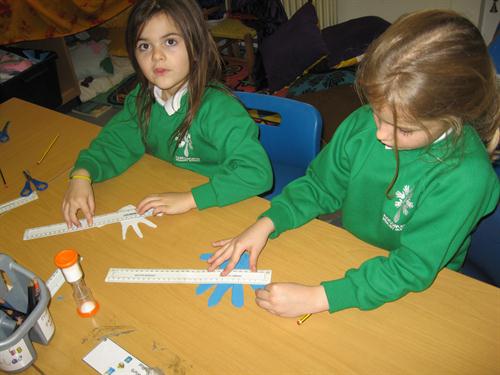
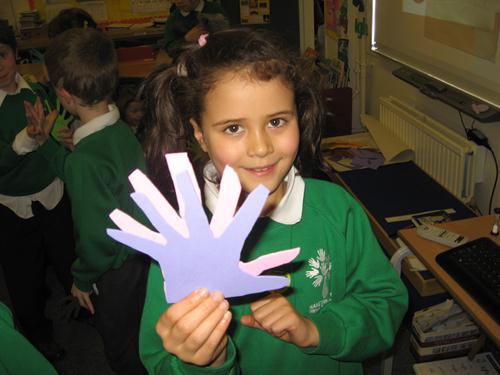
We drew around our hands and measured their spans. Then we presented our hands as a pictogram so we could see who had the smallest and largest handspans. After that we showed this information as a tally chart and a block graph.